BBT Chart
Log your temperature each morning and watch the pattern form.
How to Use This BBT Chart
Four steps to build, read, and back up your daily temperature record.
Measure Before You Get Out of Bed
Take your temperature as soon as you wake, before you get out of bed or move around much. Measure at the same time each day with a basal or digital thermometer that reads to a tenth of a degree.
Log the Reading and Add Notes
Enter one reading for each date, choose °F or °C, and add any useful notes. You can mark Period, Positive OPK, Poor sleep, Fever or illness, Alcohol, or Unusual time.
Read the Pattern
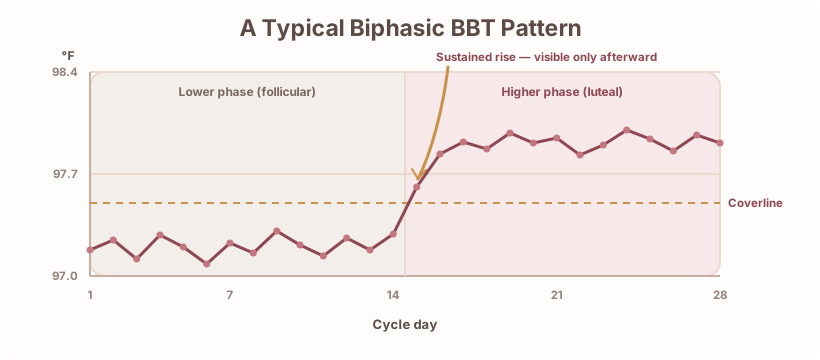
Review the line, coverline, and possible sustained temperature rise. Missing days break the line, while unusual readings and fever notes remain visible so you can interpret the pattern with context.
Export a Backup
Export your entries as a CSV file when you want a separate copy, a record to bring to an appointment, or a backup before clearing your browser data.
What This BBT Chart Can Do
Daily entries, clear chart cues, accessible records, and browser-based storage.
Fast Daily Entry
Add or update a morning temperature for any date through today, with notes available in the same form.
Fahrenheit and Celsius Display
Switch between °F and °C whenever you need. The chart converts the display while preserving the value and unit you originally entered.
Coverline and Rise Cue
See a coverline when there are enough eligible readings and a possible sustained rise appears. The cue describes a chart pattern, not a medical conclusion.
Notes for Common Disruptions
Mark period days, a positive OPK, poor sleep, fever or illness, alcohol, or an unusual measurement time. Fever-marked readings stay visible but do not take part in the coverline or rise check.
Chart and Table Together
Every plotted reading also appears in a data table with its date, temperature, notes, and marker meaning, so the same information is available without relying on the graphic alone.
Local Storage and CSV Backup
Export your entries as a CSV file whenever you want a separate copy. Your readings are stored only in this browser and are not uploaded to an account or server.
Quick Tips
The temperature shift may be small
MedlinePlus describes about 0.2°F or more above the previous six days, while StatPearls describes a common rise of about 0.5–1°F after ovulation. Look for a sustained pattern rather than one isolated reading.
BBT is a look-back signal
A rise becomes visible after the temperature has changed, so BBT does not give advance notice of your fertile window. For a calendar-based estimate before the shift, use the ovulation calculator.
Add context to disrupted readings
Fever or illness, alcohol, poor or interrupted sleep, and measuring at a different time can affect a reading. Add a note instead of assuming every change reflects your cycle.
Unit changes preserve your entry
Switching between °F and °C converts what you see on the chart and in the table. It does not rewrite the value and unit you originally entered.
Sources
- Basal body temperature method for identifying fertile days — MedlinePlus, U.S. National Library of Medicine
- Physiology, Ovulation and Basal Body Temperature — StatPearls, NCBI Bookshelf
BBT Chart FAQ
Related Cycle and Fertility Calculators
Keep exploring your cycle with these free tools.